globalchange  > 过去全球变化的重建
新闻题名:
New Digital Maps Depict Alaska in Unprecedented Detail
出版(发布)日期: 2016-09-06
语种: 英语
正文(英文):

Geology & Geophysics News

The Obama administration plans to release high-resolution terrain models in 2017 for the entire Arctic.

By

Digital topographic map of Gulkana Glacier, eastern Alaska Range.
The Gulkana Glacier and river valley region, located along the south flank of the eastern Alaska Range, is a U.S. Geological Survey glacial monitoring site. Credit: NSF/NGS

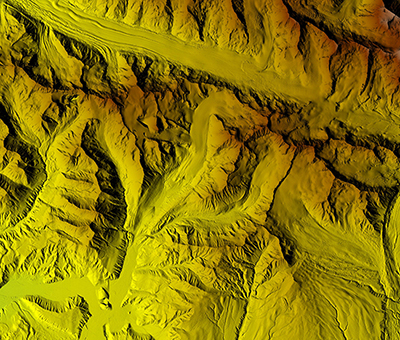
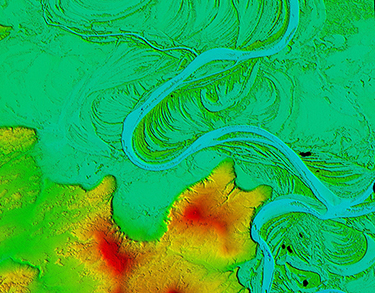
Newly unveiled high-resolution digital topographic maps of Alaska display, more sharply than ever before, the state’s landscape. The images will help with decision making and provide a better understanding of the impact of climate change, according to U.S. government officials.

The unclassified three-dimensional (3-D) digital elevation models (DEMs), which the U.S. National Geospatial-Intelligence Agency (NGA) and the National Science Foundation (NSF) released Thursday, provide at least 2-meter resolution throughout the state. The White House also announced plans to release these sorts of elevation models, at lower resolution, in 2017 for the entire Arctic.

To construct the topographic models, image-processing algorithms convert stereo pairs of 2-meter-resolution imagery, captured by DigitalGlobe commercial satellites, into 3-D imagery, according to NSF. The agency noted that satellites can reimage even remote areas within shorter time intervals and at less cost than aircraft. “In a changing Arctic, [the ability to capture new imagery more frequently] is huge,” said Kelly Falkner, director of NSF’s Division of Polar Programs.

Congressional Thumbs Up

Fabien Laurier, senior policy adviser with the White House Office of Science and Technology Policy, told Eos that the new Alaska models provide 15 times higher resolution than 30-meter-resolution models that, until now, were the best publicly available for the state. By providing 2-meter resolution, he noted, the new models depict Alaska’s terrain about as sharply as 1- to 2-meter-resolution models already available for most U.S. states and much of the industrial world.

Digital topographic map of Mount Aniakchak, Aleutian Range of Alaska.
Mount Aniakchak, a volcanic caldera, located in the Aniakchak National Monument and Preserve in the Aleutian Range of Alaska. Credit: NSF/NGA

That pleases U.S. Sen. Lisa Murkowski (R-Alaska), who told Eos that “Alaska and the Arctic are woefully left behind when it comes to mapping and charting across the board, so any progress is important to ensure the safety and well-being of our state. Although there is still a mountain of work to be done, I applaud the efforts of the NGA and NSF and look forward to their upcoming releases in 2017.”

Game Changers

The models are “game changers,” according to John Farrell, executive director of the U.S. Arctic Research Commission: “They can be used for a whole slew of purposes, from better understanding landscape evolution to just even simple navigation.” The new tools can provide local communities with “science-based actionable knowledge” that could improve their resilience in the face of climate change and its impacts, Laurier added.

The terrain modeling of Alaska and the Arctic is creating an archive of high-resolution imagery of the region at a critical time, said Tom Heinrichs, director of the Geographic Information Network of Alaska at the University of Alaska Fairbanks. “Both the DEM itself and the source stereo pair imagery will be invaluable to future scientists seeking a snapshot of the Arctic during the onset of a period of major global climate change,” he predicted.

Digital topographic image of Koyukuk River in western Alaska.
The winding Koyukuk River in western Alaska is a 684-kilometer-long tributary of the Yukon River. The digital elevation models show, in greater detail than ever before, the unique boreal forest vegetation patterns that surround the river region. Credit: NSF/NGA

According to Laurier, the Arctic-wide models aim to provide at least an 8-meter resolution by the end of the U.S. rotating chairmanship of the Arctic Council in 2017.

A public-private partnership— including NSF, NGA, the University of Minnesota’s Polar Geospatial Center, the U.S. Geological Survey, the Environmental Systems Research Institute, Inc., and others—is carrying out the modeling project in response to a 2015 White House Executive Order on “Enhancing Coordination of National Efforts in the Arctic.”

—Randy Showstack, Staff Writer

Citation: Showstack, R. (2016), New digital maps depict Alaska in unprecedented detail, Eos, 97, https://doi.org/10.1029/2016EO058685. Published on 06 September 2016.
© 2016. The authors. CC BY-NC-ND 3.0
  • davidlaing

    Climate change was essentially stopped by the Montreal Protocol toward the end of the 20th century because the cause was not anthropogenic CO2, as assumed by the climate models, but thinning of the ozone layer caused by CFCs, resulting in greater solar UV-B irradiation. The spike in 2015-16 was not anthropogenic, but was caused by the eruption of Iceland’s Bardarbunga volcano releasing HCl and HBr into the atmosphere, which also thinned the ozone layer. It was the largest non-explosive eruption since Laki in 1783.

    • cshorey

      Volcanoes have an immediate cooling effect, not warming effect. The sulfate aerosols emitted reflect light back to space. Your analysis is completely off. The CO2 warming is not “assumed by the climate models” it was measured by John Tyndall, Samuel Langley, and the U.S. Air Force after WW2. Your phrasing implies you don’t know all this science background.

      • davidlaing

        There are two kinds of volcanic eruptions, explosive (mainly plate leading edge andesitic), which cause cooling by injecting aerosols into the stratosphere, and non-explosive (mainly plate trailing edge and mantle plume basaltic), which deplete ozone by emitting hydrides of chlorine and bromine. Bardarbunga was one of the latter. I am not an analyst, I am a synthesist. Tyndall and Langley made theoretical assumptions and did no experiments. The U.S. Air Force studied the absorption characteristics of CO2, but did no experiments showing that CO2 caused warming. Knut Angstrom did perform experiments in 1900 that showed CO2 does not cause warming. No experiments have been performed since. Do you have any other gratuitous comments to offer?

        • cshorey

          Except you need to 1) inject that Br and Cl into the stratosphere, 2) deplete the ozone, and 3) then allow the extra energy to be absorbed somehow into the climate system. I am going to take a guess you don’t have a decent line of evidence for the claim that Bardarbunga was able to do this so rapidly and so much as to cause the recent warmest years on record. Meanwhile, your statement that Tyndall and Langley did no experiments is just flat out wrong. Tyndall was using the spectrometer he invented to do experiments on EMR absorption and Langley used the Bolometer to measure the effect through our atmosphere in the real world. Sounds like experiments to me, so sorry if you think it is “gratuitous”. Then I’ll add in Arrhenius who showed that water can’t drive climate change due to it’s tie to ocean temperature, so the only plausible candidate for climate change was the longer lived CO2. We then add the experiments by the Air Force telling us exactly how EMR is absorbed at all levels of the atmosphere so we could predict which wavelengths would be retained. Now I’ll add the satellite measurements that measured which wavelength are preferentially retained in the last few decades, and its the same ones predicted by the Air Force work, and unless you throw out the first law of thermodynamics, that is exactly a connected path showing CO2 to be driver of climate change. And then we can come at it from the other direction. The PETM looks to be methane ejection in the atmosphere, which then converts to CO2, and all the climate change in the PETM is explainable thusly. And then we add on the post-Carboniferous ice age. What would a decrease in CO2 in the Carboniferous predict with the experimental evidence above coupled with the best theoretical support? A reduction in CO2 should cause a lowering of global temperature, and dang if that isn’t what happened. Is that gratuitous enough for you?

  • Peter Griffith

    NASA’s Arctic Boreal Vulnerability Experiment will also release a complementary DEM for boreal Canada south of 60 later in 2017, using the same workflow, in partnership with PGC and NGA. http://above.nasa.gov

  • David Bockman

    ‘The Obama administration plans to release high-resolution terrain models in 2017 for the entire Arctic.’

    How will it do that when it won’t exist in 2017?

    • Ed Lindgren

      Obama will have about three weeks to fit it in, but will be too busy playing those final rounds of golf on the public dime.

    • Nedward Marbletoe

      The universe won’t exist next year due to scheduled renovations, but a temp has been hired to fill in while the work is being done. Most people will not notice any difference.

URL: https://eos.org/articles/new-digital-maps-depict-alaska-in-unprecedented-detail
资源类型: 新闻
标识符: http://119.78.100.158/handle/2HF3EXSE/58642
Appears in Collections:过去全球变化的重建
气候减缓与适应

Files in This Item:

There are no files associated with this item.


Recommended Citation:
. New Digital Maps Depict Alaska in Unprecedented Detail. 2016-09-06.
Service
Recommend this item
Sava as my favorate item
Show this item's statistics
Export Endnote File
Google Scholar
Similar articles in Google Scholar
百度学术
Similar articles in Baidu Scholar
CSDL cross search
Similar articles in CSDL Cross Search
Related Copyright Policies
Null
收藏/分享
所有评论 (0)
暂无评论
 

Items in IR are protected by copyright, with all rights reserved, unless otherwise indicated.