
Compared to other stars, our Sun is a remarkably steady source of light and heat, but its output does vary. Solar light, heat, and particle streams drive weather and atmospheric chemistry, but how (and how much) does the Sun’s variability affect the climate here on Earth? The role of solar variability in recent global warming is not just a bone of contention; it is also a question of overriding importance for the scientific understanding of our Sun and of climate change.
Scientists simulate historical and future climates by setting up a suite of initial conditions and seeing how these conditions change when various factors, called forcings, are applied. For example, how does Earth’s surface temperature change if it receives more or less heat from the Sun? How do the streams of ionized particles that make up the solar wind affect certain weather patterns on Earth? Data sets compiled from historical records provide the necessary information for model forcing, so ensuring that these data sets provide accurate, relevant information is key to producing realistic climate model scenarios.
Recently, a series of initiatives brought together scientists working on different aspects of this highly multidisciplinary issue. These efforts shared several common objectives, including better estimates of solar forcing and identifying and quantifying the uncertainties in these estimates.
Here we report on the outcome of three of these initiatives:
- “Towards a more complete assessment of the impact of solar variability on the Earth’s climate” (TOSCA), a project that uses a network of European scientists from 20 countries that met from 2011 to 2015 to assess contributions of solar variability to Earth’s climate
- Solar Irradiance Data Exploitation (SOLID), a European-funded project dedicated to merging all exploitable spectrally resolved solar irradiance records into one single composite data set
- An international team of scientists that met at the International Space Science Institute (ISSI) to produce a comprehensive data set that includes solar radiative forcing and contributions from energetic particles
These initiatives have culminated in the production of two public data sets to assist with the scientific analysis of solar forcing: a composite data set of all irradiance observations and a comprehensive data set containing different solar forcings (radiative and by particles) since 1850.
How Does Solar Variability Affect Climate?
Solar variability affects Earth’s climate in many intricate and nonlinear ways. Most effects are ultimately driven and modulated by the solar magnetic field and its conspicuous solar cycle, which repeats approximately every 11 years.
The effect of solar variability on climate is mostly hidden in the natural variability of the climate system; thus, careful statistical analysis is required to extract it from a noisy background. Such analyses require records that extend over a long period of time, but the paucity of observations in existing records poses a serious challenge. For example, scientists have been making direct measurements (from space) of the total solar radiative input into Earth’s atmosphere only since 1978, although there had been earlier attempts to measure it from the ground.
Although solar radiation represents more than 99.9% of the energy entering Earth’s system, radiation is not the only means by which solar variability affects climate. Another source of variability comes from energetic particles, some of which originate from the Sun.
The most energetic particles, known as galactic cosmic rays, have an extragalactic origin; their role in cloud formation has attracted strong media attention. However, recent experiments at the European Organization for Nuclear Research (CERN) suggest that these cosmic rays have a limited impact on the microphysics of clouds. Energetic protons produced during solar flares and energetic electrons that originate from the Earth’s magnetosphere have received much less attention, yet they may play a role by contributing to catalytic ozone loss in the polar atmosphere [Andersson et al., 2014]. Such ozone depletion primarily affects the upper layers of the atmosphere (60–80 kilometers) but eventually it affects the lower layers and climate as well.

For many years, a single quantity, total solar irradiance (TSI), which describes the total solar radiated power incident on Earth’s upper atmosphere, was used to summarize the solar contribution into climate models, neglecting other contributions. The assumption was that solar radiation would mainly act on Earth’s environment by directly heating the oceans, continents, and lower atmosphere.
The discovery of the effects of radiation in the ultraviolet (UV) wavelength band shattered this simple picture. Researchers have shown that UV radiation affects climate through direct heating and the production and destruction of ozone in the stratosphere, which then leads to regional effects at Earth’s surface through a complex chain of mechanisms. All these effects, however, are found to have a minor impact on climate in comparison to recent man-made global warming.
Splitting Up the Spectrum
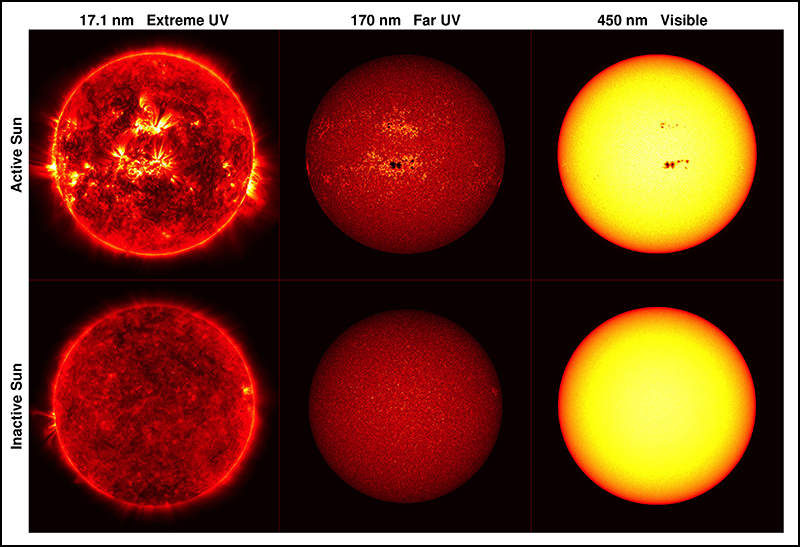
Although the TSI is a key ingredient in Earth’s global energy budget, the spectrally resolved solar irradiance (SSI) provides much deeper insight into the impact of solar variability on the atmosphere. Unlike TSI, which integrates the contribution from all spectral bands (UV, visible, infrared) into one single quantity, SSI reveals variations at specific wavelengths, each of which affects Earth’s environment in a different way.
Unfortunately, the record of SSI observations is fragmented in time and in wavelength, even more so than TSI observations.
Making accurate SSI observations is a real challenge: SSI measurements must be carried out from space to capture radiation that would otherwise be partly absorbed by Earth’s atmosphere. However, instruments degrade in the harsh environment of space, leaving researchers with large uncertainties in the data.
On the few occasions when several instruments measured the SSI simultaneously, their observations often disagreed, which highlights the importance of calibrating the instruments and having several of them that operate simultaneously. For example, NASA’s Solar Radiation and Climate Experiment (SORCE) mission, which started operating in 2003, reported an unusually large solar cycle variability in the UV. This variation remains hotly debated since most wavelengths are monitored only by SORCE, with no alternative observations.
Difficulties like these have been a major impediment to a more systematic scientific exploitation of SSI observations, and they remain the prime reason for the large uncertainties on the long-term evolution of solar radiative forcing.
The TOSCA Handbook
To help overcome these difficulties, TOSCA produced a handbook that summarizes our present understanding of these different processes by which solar variability may affect climate [Lilensten et al., 2016]. This handbook was the main outcome of TOSCA, a pan-European COST Action(Cooperation in Science and Technology) network of scientists devoted to that question. This handbook addresses the assumptions, the data, the models, and the unknowns behind the numerous mechanisms by which solar variability may impact climate variability.
Solar Data Sets
Coinciding with the publication of the TOSCA handbook, scientists produced a data set describing solar forcing through SOLID, a European-funded project with worldwide contributions, which aimed at merging all exploitable SSI records into one single composite data set.
This merged data set, which has recently been made public, covers the period from 1978 to the present [Haberreiter et al., 2017]; it includes data for the UV, visible, and near-infrared bands. To guarantee transparency and traceability, a statistical procedure was developed to merge the original measurements from 20 instruments and also to produce data-driven estimates of their uncertainties.
SOLID’s observational composite is a major first step toward improved versions, and we are now awaiting community feedback to determine if corrections should be applied and what they should be. One of the lessons we learned from this exercise is the importance of separating the methodological problem (What is the best way of constructing the composite?) from the scientific one (What prior information goes into the correction of the original data sets?).
An addition, a new community-driven reference composite for TSI only is also expected soon. This new TSI composite should replace three existing ones whose differing trends have fueled fierce debates.
Elusive Long-term Irradiance Variations

Because SSI observations really took off only in the late 1990s, we still lack the necessary hindsight to properly assess the impact of solar variability on climate: Longer records are needed. Today, we must rely on SSI records produced by models that rely on solar proxies such as the sunspot number and cosmogenic isotopes such as carbon-14.
Several empirical and semiempirical models have been developed for that purpose, and most match the observations well. That is, they reproduce recent observations well over the short period on which they have been trained, typically one or a few decades.
How accurately these models reproduce SSI before direct observations started remains a major open question. All these models assume that the present relationship between SSI and solar proxies holds for past variations. The recent and unusually long period of low solar activity that took place in 2008–2009, however, challenges our ability to reconstruct solar activity from proxies.
A Comprehensive Data Set on Solar Forcing
To overcome challenges with solar irradiance models, scientists need to piece together a record longer than the past few decades. An international team of scientists, challenged by the fragmentation of historical solar forcing data, met at ISSI to produce another comprehensive data set for direct use by climate modelers, who require long-term reconstructions.
This data set, which runs from 1850 to 2015, includes solar radiative forcing using TSI and SSI reconstructions. It is the first to incorporate contributions from energetic particles such as magnetospheric electrons, solar protons, and galactic cosmic rays. Here, too, we welcome community feedback for improving future versions. The data set comes with recommendations on solar-induced ozone variations that are consistent with these solar forcing data, and it has been recommended for the current Coupled Model Intercomparison Project Phase 6 (CMIP6) initiative [Matthes et al., 2017].
Moving Ahead
What is now the way forward? Clearly, improving our understanding of the physical mechanisms on the Sun that drive irradiance variations, particularly those that may lead to long-term climate variations, should be a priority. Several teams are actively working on this issue.
We are still missing an international framework that enables a critical comparison of irradiance models with the aim of improving them. The highest priority, however, is to continue simultaneous total and spectral irradiance observations by different instruments. Our ultimate aim is to quantify more precisely the role of the Sun in the natural forcing of climate variability and climate change.
In short: The Sun still has a lot to tell us.