
It has been 8 years, one pandemic, and a slew of wildfires, storms, and heat waves since the last United Nations climate assessment report was released in 2013. During that time, 191 parties signed the Paris Agreement; the United States (the world’s second-largest emitter) left and reentered the agreement; renewable energy outpaced coal in the United States and all fossil fuels in Europe for the first time; and greenhouse gas emissions crashed worldwide during stay-at-home orders before springing back.
It is with this backdrop that the Intergovernmental Panel on Climate Change (IPCC) unveiled its new assessment of global climate science.
Started in 1988 by the U.N. Environment Programme and the World Meteorological Organization, the IPCC supplies policymakers with policy-neutral information about climate change. The IPCC does not conduct its own research: It summarizes the work by global experts and notes where disagreements lie. More than 200 authors from 66 countries in the organization’s Working Group I wrote the latest report. The document includes more than 14,000 cited references. All eyes are turning to October’s U.N. Climate Change Conference of the Parties (COP26) in Glasgow, Scotland, where the latest report will inform negotiations.
The report predicts that warming will reach 1.5°C by the early 2030s, exceeding the lower goal of the Paris Agreement. How much further the temperatures rise will depend on emissions. Each of the world’s top three emitters—China, the United States, and the European Union—have goals to slow the rate of emissions this decade.
The IPCC report spells out what could happen if we don’t meet these targets: The Arctic could be ice free by mid- to late century. Sea level could rise by a meter by 2100, inundating cities. And extreme heat waves could become more intense and frequent.
Here are five takeaways.
1. Global Warming Thus Far
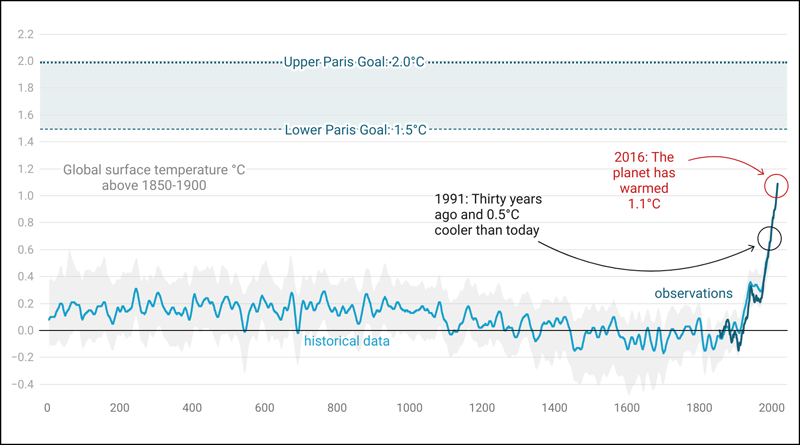
In the past 100,000 years, Earth has been this warm only once. Around 6,500 years ago, the planet’s temperatures were about on par with what they are today. The difference? That warming was part of an ebbing and flowing cycle of ice sheets from natural variation of Earth’s orbit. Today’s temperatures come from pollution that will continue to grow unless we hit the brakes.
Today, some areas on Earth have already warmed beyond 2°C. The Washington Post reported in 2019 that 71 counties in the United States have already warmed past 2°C. Temperatures in the Arctic are rising at least twice as fast as the rest of the world. Islands are particularly at risk: The rallying cry for 1.5°C originated from an alliance of 44 small island states that commissioned a study in 2008 and became alarmed that 2°C warming would threaten their survival.
Previous climate agreements favored a 2°C rise, but mounting evidence suggests that keeping temperatures to a 1.5°C rise would greatly reduce extreme heat, instances of extreme precipitation and drought, sea level rise, species loss and extinction, and ocean acidification.
Global temperatures have a 20% chance of reaching 1.5°C above preindustrial levels during at least one of the next five years, according to the U.K. Met Office and the World Meteorological Organization.
2. Future Warming Pathways

Future illustrative scenarios of warming are one of the hallmarks of IPCC reports. The scenarios include natural forcing like solar activity and volcanoes, along with social and economic forces that drive greenhouse gas emissions, land use, climate mitigation, and air pollution.
The scenarios aren’t predictions; they can’t determine the fate of global warming. Instead, they provide road maps. The scenarios often underpin international policy, research, and activism for years to come.
The new report has five scenarios: two with low emissions, one with intermediate emissions, and two with high emissions. The very low emissions scenario meets the 1.5°C Paris Agreement goal with likely warming of 1.4°C by 2100—but it overshoots the target to just above 1.5°C midcentury before decreasing to 1.4°C. The low emissions scenario reaches 1.8°C by 2100, just skirting under the high bounds of the Paris Agreement. Midlevel emissions hit 2.7°C, high emissions clock in at 3.6°C, and very high emissions extend to 4.4°C in 2100.
Climate scientist and IPCC Working Group I cochair Valérie Masson-Delmotte said that the midlevel emissions scenario most closely resembles the pledges made by countries to plateau emissions until around 2030. The highest emissions scenarios represent futures without any climate mitigation.
The last IPCC assessment in 2013 included just one low emissions scenario that kept warming under 2°C.
3. Carbon Dioxide’s Oversized Footprint

Greenhouse gases include CO2, methane, nitrous oxide, and fluorinated gases. When headlines or politicians talk about “net zero carbon” or “carbon neutral,” it may seem like they’re leaving out other greenhouse gases. But although most climate targets aim to reduce greenhouse gas emissions as a group, the essential ingredient is carbon dioxide.
The graph above illustrates why.
Warming is overwhelmingly controlled by the amount of carbon dioxide in the atmosphere. There is a nearly linear relationship between cumulative carbon dioxide increasing and global surface temperatures rising. The latest report even has an equation for it: Every 1,000 metric gigatons of cumulative CO2 emissions (GtCO2) will likely cause planetary warming of 0.45℃.
4. Annual Carbon Dioxide Emissions

Carbon emissions come from burning oil, gas, and coal; these fossil fuels drive heating, electricity, agriculture, land use, industry, and transport.
During COVID-19, emissions fell an unprecedented 2.6 GtCO2 in 1 year, according to research published in Nature Climate Change in 2021. Because the emissions cuts during the pandemic were temporary, those reductions won’t have any detectable effect on CO2 concentrations or temperature. The researchers of the Nature Climate Change study predict that emissions cuts of about this scale (1–2 GtCO2) are necessary at least through the 2020s to meet the Paris Agreement.
5. Carbon Extraction

Carbon naturally cycles through the soil, water, plants, and air continuously. We can draw carbon out of the atmosphere by planting trees, sequestering carbon in agricultural soil, restoring ocean ecosystems that store carbon, and applying carbon capture and storage technology.
Model simulations in the latest report suggest that removing carbon dioxide from the atmosphere drops temperatures in just a matter of years.
Although some carbon removal methods show promise, the practice remains in the research and development phase and would require deployment at massive scales, according to the report. Carbon capture could cause undesirable effects such as losses of biodiversity, water, or food production.
More to Come
The report by Working Group I on the physical science is one of four expected over the next year; reports from Working Group II in February 2022 and Working Group III in March 2022 will explore the impacts of climate change and mitigation, respectively. The synthesis report in November 2022 will combine all findings.
—Jenessa Duncombe (@jrdscience), Staff Writer
References
Intergovernmental Panel on Climate Change (IPCC) (2021), Summary for policymakers, in Climate Change 2021: The Physical Science Basis. Contribution of Working Group I to the Sixth Assessment Report of the Intergovernmental Panel on Climate Change, edited by V. Masson-Delmotte et al., Cambridge Univ. Press, Cambridge, U.K., in press.